Fonterra Australia FY24 Interim Results
Fonterra Co-operative Group Ltd’s FY24 Interim Results were announced today.
Fonterra Australia delivered EBIT of NZ$42m (AU$39m). This was down 43% vs the first half of last year, mainly due to the high cost of milk in Australia, which is disconnected from global commodity prices.
It reported gross profit of NZ$138m (AU$128 million), a decline of 19% for the same period last year.
Gross margin was down 1.8%, operating expenses remained steady, and milk collections and sales volumes are in line with the prior first half.
Fonterra Australia Managing Director René Dedoncker said that while earnings were down, the Australian business is strong with solid fundamentals.
“Our Australian business remains profitable with good domestic demand, and we continue to see value growth in Consumer and Foodservice.
“Our Consumer brands remain No.1 in the butter & spreads and cheese categories. This has been achieved despite a shift in consumer demand to private label and lower-price competitor products – which is only possible due to the strength of our brands.
“For Foodservice, out-of-home demand is subdued due to macro-economic conditions impacting household and business budgets. We remain focused on delivering an unrivalled customer experience, which has helped us to maintain our No.1 ranking in the Foodservice Advantage Survey for the fifth consecutive year.
“The financial performance of our Ingredients business is impacted when the milk price is high relative to commodity pricing. However, we are pleased to be growing our value-add proposition and have increased sales for our proteins, functional nutrition and probiotics.
“The Australian market has been challenging for many dairy processors over the last 12 months.
“For Fonterra, our focus is on reducing our costs and improving return on capital. Work is well underway to identify and implement a range of initiatives which will deliver cost savings for our business,” Mr Dedoncker said.
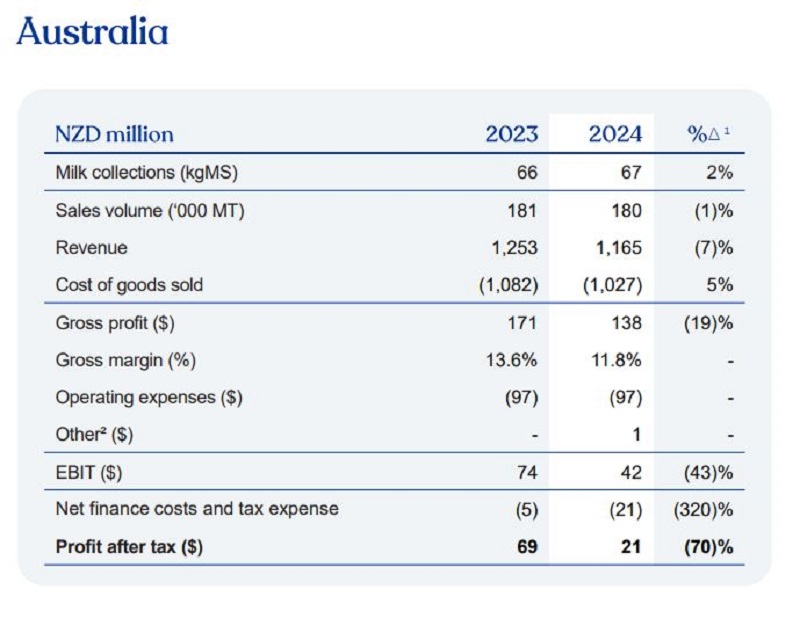 Source: Fonterra FY24 Business Performance Report, Page 46
Additional Notes:
Table is in NZD
Figures are prepared on a continuing operations basis.
1. Percentages as shown in table may not align to the calculation of percentages based on numbers in the table due to rounding of figures
2. Consists of other operating income and net foreign exchange gains/(losses)
Source: Fonterra FY24 Business Performance Report, Page 46
Additional Notes:
Table is in NZD
Figures are prepared on a continuing operations basis.
1. Percentages as shown in table may not align to the calculation of percentages based on numbers in the table due to rounding of figures
2. Consists of other operating income and net foreign exchange gains/(losses)